My last blog post compared the time for the men who ran both the 2012 Gold Discovery Run and the Equinox Marathon in order to give me an idea of what sort of Equinox finish time I can expect. Here, I’ll do the same thing for the 2012 Santa Claus Half Marathon.
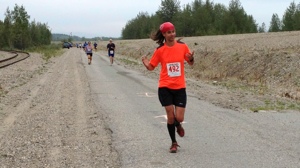
Yesterday I ran the half marathon, finishing in 1:53:08, which is an average pace of 8.63 / 8:38 minutes per mile. I’m recovering from a mild calf strain, so I ran the race very conservatively until I felt like I could trust my legs.
I converted the SportAlaska PDF files the same way as before, and read the data in from the CSV files. Looking at the data, there are a few outliers in this comparison as well. In addition to being ouside of most of the points, they are also times that aren’t close to my expected pace, so are less relevant for predicting my own Equinox finish. Here’s the code to remove them, and perform the linear regression:
combined <- combined[!(combined$sc_pace > 11.0 | combined$eq_pace > 14.5),]
model <- lm(eq_pace ~ sc_pace, data=combined)
summary(model)

Call:
lm(formula = eq_pace ~ sc_pace, data = combined)

Residuals:
     Min       1Q   Median       3Q      Max
-1.08263 -0.39018  0.02476  0.30194  1.27824

Coefficients:
            Estimate Std. Error t value Pr(>|t|)
(Intercept) -1.11209    0.61948  -1.795   0.0793 .
sc_pace      1.44310    0.07174  20.115   <2e-16 ***
---
Signif. codes:  0 ‘***’ 0.001 ‘**’ 0.01 ‘*’ 0.05 ‘.’ 0.1 ‘ ’ 1

Residual standard error: 0.5692 on 45 degrees of freedom
Multiple R-squared: 0.8999,     Adjusted R-squared: 0.8977
F-statistic: 404.6 on 1 and 45 DF,  p-value: < 2.2e-16
There were fewer male runners in 2012 that ran both Santa Claus and Equinox, but we get similar regression statistics. The model and coefficient are significant, and the variation in Santa Claus pace times explains just under 90% of the variation in Equinox times. That’s pretty good.
Here’s a plot of the results:
As before, the blue line shows the model relationship, and the grey area surrounding it shows the 95% confidence interval around that line. This interval represents the range over which 95% of the expected values should appear. The red line is the 1:1 line. As you’d expect for a race twice as long, all the Equinox pace times are significantly slower than for Santa Claus.
There were fewer similar runners in this data set:
| Runner | DOB | Santa Claus | Equinox Time | Equinox Pace |
|---|---|---|---|---|
| John Scherzer | 1972 | 8:17 | 4:49 | 11:01 |
| Greg Newby | 1965 | 8:30 | 5:03 | 11:33 |
| Trent Hubbard | 1972 | 8:31 | 4:48 | 11:00 |
This analysis predicts that I should be able to finish Equinox in just under five hours, which is pretty close to what I found when using Gold Discovery times in my last post. The model predicts a pace of 11:20 and an Equinox finish time of four hours and 57 minutes, and these results are within the range of the three similar runners listed above. Since I was running conservatively in the half marathon, and will probably try to do the same for Equinox, five hours seems like a good goal to shoot for.
